Following the February 2024 investigation into Listeria monocytogenes contamination linked to Queso Fresco and Cotija cheese🧀, I embarked on a comprehensive analysis of Listeria outbreaks over a 12-year period, focusing on the key trends and environments that drive these outbreaks.
Listeria monocytogenes (or L. monocytogenes) is a type of bacteria that can make you sick. It hangs out in places like soil, water, decaying plants, animals, and damp areas.
You usually pick up L. monocytogenes when food is handled or stored in places where the bacteria is present, like during harvesting, processing, or transporting. It can spread through things like raw materials, water, soil, or even the air. source
Pets can also bring the bacteria into your home if they eat contaminated food.
What makes it tricky is that it can survive and even grow in the fridge, so it’s not always easy to get rid of. If you eat food contaminated with this bacteria, you might develop an illness called listeriosis.
Image Source: FDA.gov
As part of my hands-on learning experience at Broadstreet Institute, I conducted an in-depth study of Listeria outbreak-related fatalities from 2009 to 2021. My project sought to uncover trends and pinpoint the environments most associated with Listeria monocytogenes.
As of 2024, the CDC has moved all public data on foodborne, waterborne, and stomach-related disease outbreaks from the old National Outbreak Reporting System (NORS) Dashboard (used for this project) to the new NORS View on the BEAM Dashboard. The new system includes outbreak data reported up to 2022.
To achieve these insights, I extensively utilized SAS programming for data cleaning, analysis, and visualization, transforming raw data into meaningful patterns.
Objective
The project aimed to:
Identify high-risk settings: Determine which environments (e.g., food processing facilities, retail outlets, or homes) were most frequently linked to illnesses, hospitalizations, and deaths.
Spot significant trends: Assess whether any particular year showed a surge in outbreak frequency or severity.
Recommendations
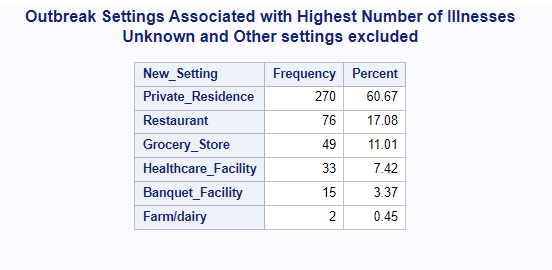
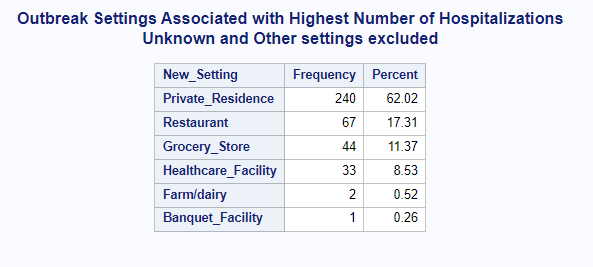
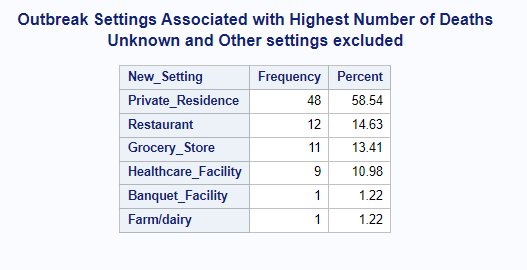
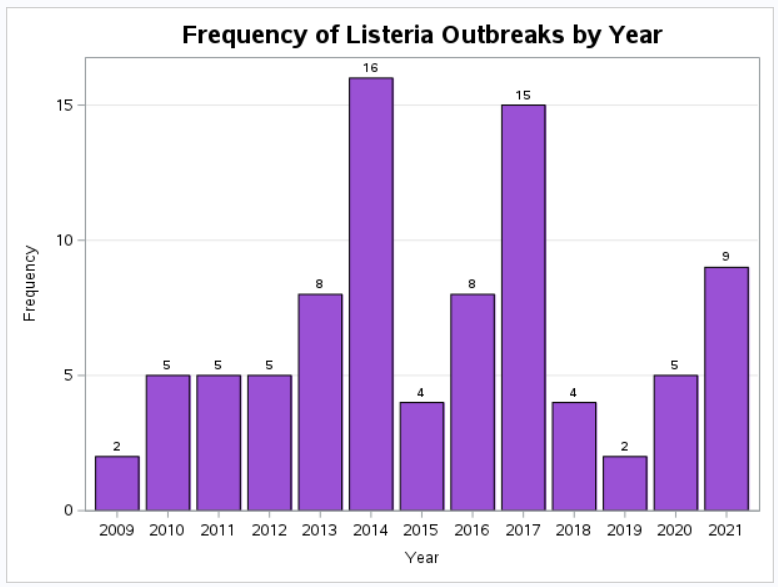
According to the data, the most significant number of illnesses, hospitalizations, and deaths were linked to homes, and the maximum frequency of Listeria outbreaks from 2009 to 2021 occurred in 2014. These observations can direct public health initiatives and regulations to lessen the effects of Listeria outbreaks.
But why is the setting for exposure highest among private homes or residences?
Steps for Analysis
Step 1 assumes the library reference is being created.
Step 2: Import the National Outbreak Public Data Tool worksheet into SAS and check out the contents of the file;
PROC IMPORT DATAFILE=NationalOutbreakPublicDataTool DBMS=XLSX OUT=WORK.IMPORT;
    GETNAMES=YES;
RUN;

PROC CONTENTS DATA=WORK.IMPORT;
RUN;
Step 3: Rename the dataset and save it to the work library to clean and manipulate the data without losing the original info;
data listeria; set Import; RUN;Step 4: List the different settings where the events have occured, and list them in desc (greatest to least) order.;
proc freq data=WORK.Listeria order=freq;
    tables Setting / plots=(freqplot);
run;
Step 5: Recategorize the different settings to reduce overlapping and over granulation of categories.;
proc sql;
    create table NewListeria as
    select *,
        case
            when Setting like "Private%" then "Private_Residence"
            when Setting like "Restaurant%" then "Restaurant"
            when Setting like "Long-term%" or Setting like "Hospital%" then "Healthcare_Facility"
            when Setting like "Grocer%" then "Grocery_Store"
            when Setting like "Banque%" then "Banquet_Facility"
            else Setting
        end as New_Setting
    from work.Listeria;
quit;
Step 6: Relist the newly categorized settings;
proc freq data=WORK.NewListeria order=freq;
    tables New_Setting / plots=(freqplot);
run;
Step 7: Create frequency tables for Illnesses, Hospitalization and Deaths. Add a title and subtitle to each table. Remove cumulative columns;
ODS noproctitle;
Title1 "Outbreak Settings Associated with Highest Number of Illnesses";
title2 "Unknown and Other settings excluded";
proc freq data= NewListeria order=freq;
    table New_Setting/nocum;
    weight illnesses;
    where New_Setting <> "Other" and New_Setting <> "Unknown";
RUN;


ODS noproctitle;
Title1 "Outbreak Settings Associated with Highest Number of Hospitalizations";
title2 "Unknown and Other settings excluded";
proc freq data= NewListeria order=freq;
    table New_Setting/nocum;
    weight hospitalizations;
    where New_Setting <> "Other" and New_Setting <> "Unknown";
RUN;


ODS noproctitle;
Title1 "Outbreak Settings Associated with Highest Number of Deaths";
title2 "Unknown and Other settings excluded";
proc freq data= NewListeria order=freq;
    table New_Setting/nocum;
    weight deaths;
    where New_Setting <> "Other" and New_Setting <> "Unknown";
RUN;
ODS reset;
Title;
Step 8: Create a bar chart that visualizes the frequency of Listeria outbreaks by year;
ods graphics / reset width=6.4in height=4.8in imagemap;
proc sgplot data=WORK.NewListeria;
    title height=14pt "Frequency of Listeria Outbreaks by Year";
    vbar Year / fillattrs=(color=CX9a51d5) datalabel;
    yaxis grid;
run;
ods graphics / reset;
title;